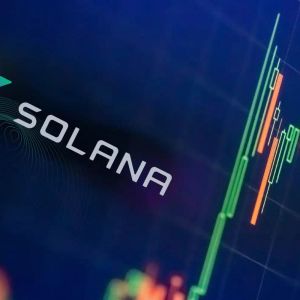
In its latest technical assessment of Solana (SOL), cryptocurrency analysis firm MakroVision stated that the correction structure predicted in their previous analysis has come true and the price has declined further with the bearish (c) wave. The company said that Solana currently appears to be in a recovery phase, but critical resistance levels need to be overcome for this move to turn into a sustained rally. According to the analysis, the overall downward pattern in Solana remains corrective, defined by the blue (A)-(B)-(C) formation. This structure may be completed in the short term. However, whether the recovery will transform into an impulsive, strong, and sustainable upward wave will become clear in the coming days. If the recovery is merely a new corrective wave, the current uptrend may be limited. Technical analysis chart shared by MakroVision. Related News: JUST IN: UK Allegedly Plans to Sell $5 Billion Worth of Bitcoin - Is This the Reason for the Decline? MakroVision notes that the $223 level, in particular, represents a strong resistance area with high liquidity. A break above this level could be the first sign of a sustained upward trend. After $223, the next significant hurdle is $246. A break above this level could trigger a move towards the $270 region for Solana. Meanwhile, support levels to watch in the event of a potential pullback are also being carefully considered. $198 (0.5 Fibonacci) and $193 (0.618 Fibonacci) are seen as short-term support zones, while $188 is considered a strong support level. A break below this level could see Solana re-enter a downtrend and test lower levels. *This is not investment advice. Continue Reading: What Lies Ahead for Solana (SOL) Prices? Analysis Company Releases Technical Analysis
Related News

Ripple Destekçilerine Müjde! Donald Trump’tan XRP İçin Stratejik Hamle!
David Sacks, White House AI & Crypto Czar olarak atandı. Atama, Ripple lehine umutları artırd...
Dec 06 2024
Read More
Bitcoin Fiyatında Şok Gelişme! 103 Bin 679 Dolar Zirvesi Sonrası Fundamental Endeksi Dibe Gidiyor!
Glassnode kurucu ortakları Bitcoin için düzeltme uyarısı yaptı. Bitcoin Fundamental Index d�...
Dec 06 2024
Read More
Tehlike Çanları ABD Doları İçin Çalıyor! Ünlü Ekonomistten Çarpıcı Uyarı!
Peter Schiff, Bitcoin'in ABD dolarını tehlikeye atabileceğini söyledi. Schiff, hükümet...
Dec 06 2024
Read More
Halka Açık En Büyük Bitcoin Yatırımcısından Yeni Alım Duyurusu! Artık 184 Milyon Doların Üzerinde Oturuyor!
Semler Scientific, 303 adet daha Bitcoin alarak toplam varlığını bin 873 adet BTC'ye çıkardı....
Dec 06 2024
Read More
Bitcoin Tek Mumla 156 Bin Yatırımcıyı Piyasadan Sildi! Kripto Para Piyasasında Büyük Şok!
Kripto para piyasasında 1 milyar doları aşan tasfiyelerle Bitcoin 103 bin dolardan 90 bin dolara ...
Dec 06 2024
Read More
Crypto Daybook Americas: It's Glass Half Full Despite Record Short ETF Volume
Your day-ahead look for Dec. 6, 2024
Dec 06 2024
Read More
U.S. Ether ETFs Post Record Inflows, Bitcoin ETFs Add Most in Two Weeks
The investment interest comes after ether added about 60% in a month.
Dec 06 2024
Read More
Crypto Markets Have Benefited From a Positive Environment Since U.S. Election: Citi
The nomination of crypto-friendly Paul Atkins as chair of the SEC provided the final boost that prop...
Dec 06 2024
Read More